Visualizing the Hall of Fame’s Anti-Recency Bias
Feb 12, 2016 by Adam Darowski
Earlier this week, MLB Network’s Brian Kenny wrote about the Hall of Fame’s anti-recency bias at Sports On Earth. The anti-recency bias simply refers to the relative difficulty modern players have had getting into the Hall of Fame.
I wrote about this recently at The Hardball Times in a piece called The Standards of Today Would Create a Very Different Hall of Fame. In fact, surfacing the anti-recency bias is something that has been very near and dear to me for quite a while…
[P]roving this point has become something of an obsession of mine ever since I started seeing the players I cheered for struggle to gain induction to Cooperstown. This obsession culminated with the launch of a site called The Hall of Stats.
If you haven’t read that article, I hope you will (in fact, it’s up for a SABR Research Award).
The anti-recency bias is something that can be more easily understood when visualized. This graph shows the percentage of plate appearances made each year by members of the Hall of Fame (blue) and Hall of Stats (red). Please note that this only includes Hall of Famers inducted with the “Player” designation.
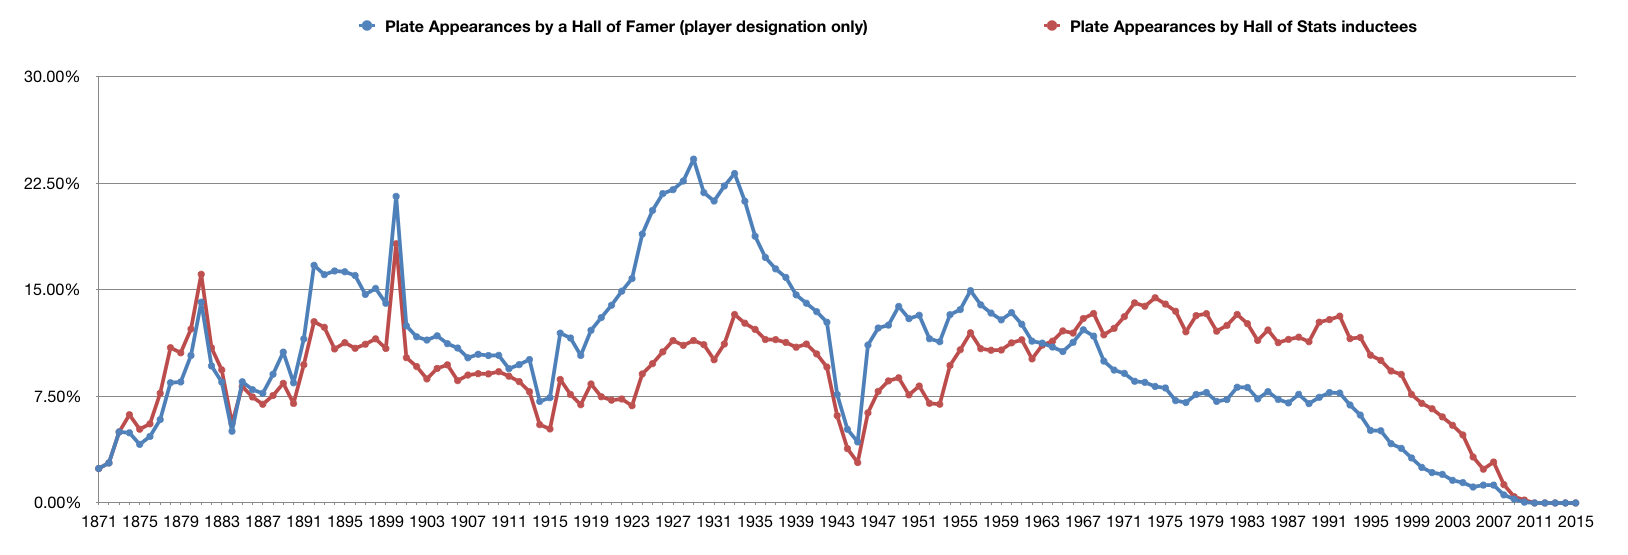
One thing in particular stands out. From 1920–1939 (a span of twenty years), 19.05% of all plate appearances were made by a Hall of Famer (peaking at 24.21% in 1929). By comparison, only 10.41% of plate appearances over that two decade stretch were made by Hall of Stats members.
Let’s look at another two decades: 1970–1989. During these twenty years, only 7.81% of plate appearances were made by a Hall of Famer. Meanwhile, Hall of Stats members made up 12.67% of all plate appearances. Does the Hall of Stats favor modern hitters a bit too much? Perhaps. That could be the effect of the steroid era. Hitters not only put up bigger numbers, but they also lasted a lot longer. Still, the Hall of Stats does not favor modern hitters as much as the Hall of Fame favors Pre-Integration Era hitters.
Let’s look at the pitchers.
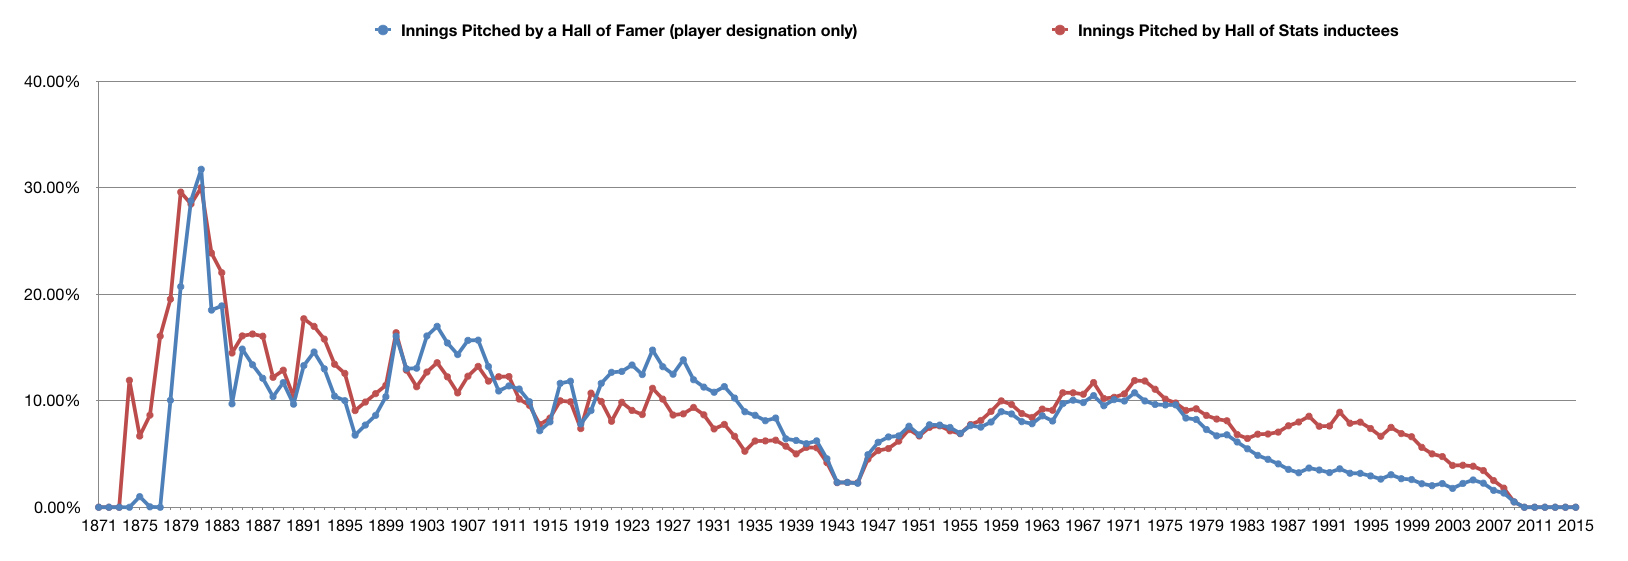
These two lines are actually much more stable. There is some slight Hall of Fame over-representation in that same 1920–1939 time period. 10.99% of innings were pitched by Hall of Famers while 7.96% were thrown by Hall of Stats members. Where we see the biggest difference is the ultra-modern era. If we look at the fifteen years from 1986–2000, we see that only 3.14% of innings were thrown by a Hall of Famer while 7.43% were thrown by a Hall of Stats member.
It’s worth noting that the Hall of Stats has no waiting period. Pitchers like Curt Schilling and Mike Mussina could gain induction and boost the Hall of Fame’s percentage somewhat. But there are still several pitchers from this era who were quickly passed over for the Hall of Fame while making it into the Hall of Stats: Kevin Brown, David Cone, Bret Saberhagen, and Dave Stieb for example.
Over the last couple of years, the Hall has admitted several starting pitchers—Randy Johnson, Pedro Martinez, Greg Maddux, Tom Glavine, and John Smoltz. All were very deserving, but a huge pitching backlog was formed because not a single starting pitcher was inducted between Nolan Ryan (1999) and Bert Blyleven (2011). Several worthy candidates came and went, but none of them were allowed in.
People like to complain that the standards for the Hall of Fame are being watered down. There’s just absolutely no evidence to back that claim up.